
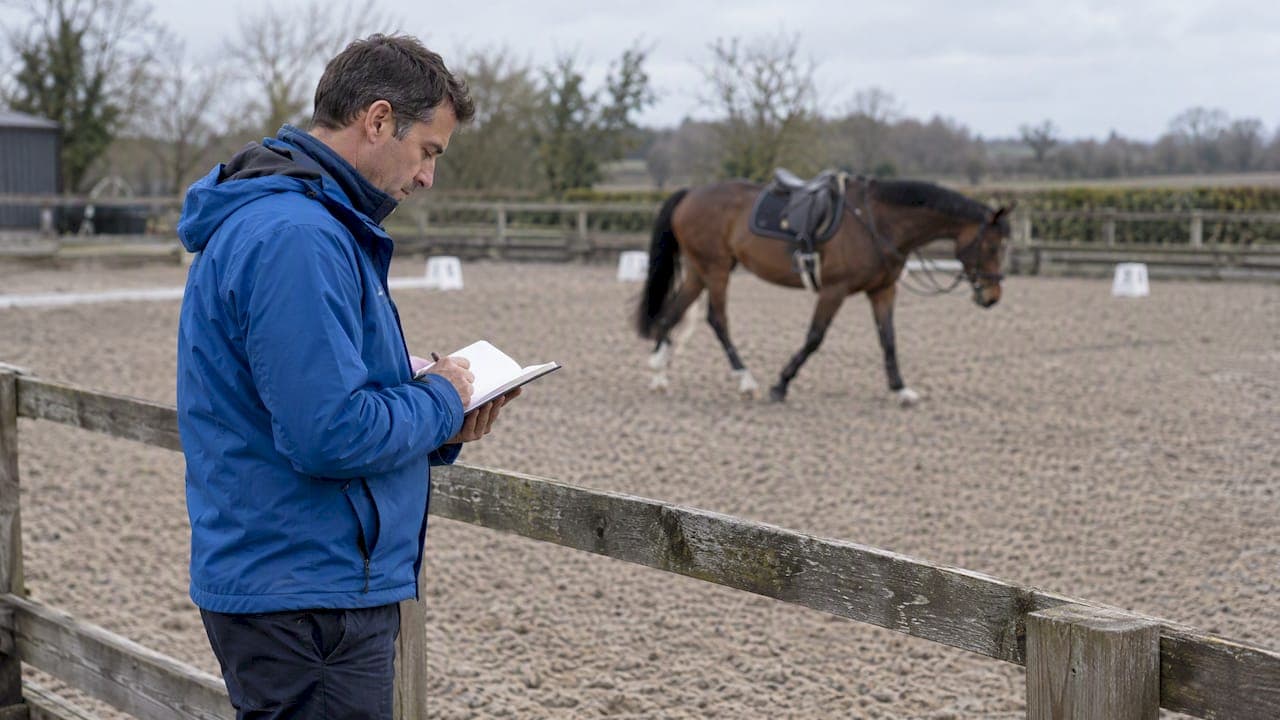
The KPIs that measure how a stable is performing fall into four groups: training load and fitness, horse welfare, owner communication and retention, and yard finances. You do not need all of them. Choose four or five that you can measure the same way every week, agree on their definitions with your team, and review them on a fixed day. This guide shows which indicators are worth the effort, which are easy to count but tell you little, and how to set them up so they change decisions rather than fill a spreadsheet.
TL;DR
- Track four or five indicators, not twenty. High-performing teams in subscription businesses focus on a handful of forward-looking measures, and the same discipline suits a yard.
- Cover four areas: training load (external and internal), animal-based welfare, owner retention and communication, and cost per horse.
- Use sensors as part of a standard test protocol, never as raw numbers read in isolation.
- Define every KPI in writing, with who records it, when and how, before you start reporting it.
- Start with one week of consistent data, then add measures only when a decision needs them.
Table of Contents
- What counts as a stable performance KPI
- Training load and fitness KPIs
- Welfare KPIs: measure the horse, not the building
- Results KPIs: use them with care
- Owner and syndicate KPIs
- Yard finance KPIs
- How to choose your four or five
- Our view: one record, few numbers, used weekly
- Putting your KPIs in one place
- FAQ
- Sources
What counts as a stable performance KPI
A KPI is a number you choose to watch because it predicts something you care about. For a professional yard that is usually some mix of sound, fit horses, owners who stay, and a business that pays its way. A stable's day produces hundreds of numbers: feed weights, canter times, vet visits, invoices, messages. Most are records. A KPI is the small subset you review on purpose and act on.
A useful test: for each candidate, write down what you would do differently if it moved. If the answer is nothing, it is a record, not a KPI. Keep it in the horse's file and leave it off the dashboard.
The measures below are grouped by the question they answer.
| Question | Example KPIs | Review rhythm |
|---|---|---|
| Are horses training well? | Weekly load, speed spikes, time at each gait, session comparisons | Weekly |
| Are horses doing well? | Forage access, turnout, body condition, behaviour and lesion checks | Weekly or monthly |
| Are owners informed and staying? | Renewal rate, owner churn, response time on updates | Monthly or quarterly |
| Is the yard sustainable? | Cost per horse, outstanding invoices, revenue per horse | Monthly |
Training load and fitness KPIs
This is where most trainers already collect data, and where it is easiest to misread it.
Research on exercise testing in horses lists the external workload measures worth recording: session duration, distance, speed, time at different gaits, number of transitions, and the number and height of jumps. Internal load, meaning what the horse's body does in response, is tracked through heart rate and blood lactate. The same source notes that GPS and heart rate monitoring give a reliable, non-invasive way to follow training adaptation in the field.
For a yard, that translates into a short list:
- Weekly volume. Total minutes and distance per horse, split by gait. This is your baseline.
- Peak speed and speed spikes. A single fast session in an otherwise quiet week is a signal worth a second look. Our guide to flagging speed spikes with ACWR explains how to compare acute with chronic load.
- Heart rate response at a standard effort. If the same trot or canter work produces a lower heart rate over several weeks, fitness is probably improving. If it rises, ask why.
- Recovery. How quickly heart rate settles after work, recorded the same way each time.
- Session-to-session comparison. The same route or the same standardised test, compared like for like. See how to compare training sessions with standard tests and filters.
Use a standard test, not just a sensor
The specialists writing on exercise testing are clear that wearables belong inside a standardised protocol. Raw sensor data without the physiological demands of the discipline in mind is a common pitfall, and a good programme adjusts intensity, frequency and duration to the individual horse's progression rather than simply doing more or less.
A practical version: choose one repeatable test per discipline, such as a fixed track at set gaits for a dressage horse or a fixed gallop piece for a racehorse. Run it every few weeks in similar conditions. The test result becomes your fitness KPI, and daily load numbers explain why it moved.
Know where the data goes wrong
Signal quality falls as speed rises. A review of field technologies in the Equine Veterinary Journal points out that movement artefacts degrade physiological recordings at speed, so electrode placement must be stable, and combining GPS, heart rate and accelerometer data gives a safer interpretation than any raw signal alone. It also cites 500 Hz as the gold standard sampling rate for ECG-based assessment. If a gallop trace looks odd, check the fit of the girth and sensors before you change the horse's program.
GPS is also the cheapest part of this stack. If you only want speed, distance and route for a first look, consumer-grade tools can do it. For example, some GPS trackers with no monthly fees are sold for vehicles, trailers and equipment, which is a useful reference when you are weighing up what location hardware costs. Horse-specific work still needs equipment designed to be worn safely and to record gait and heart rate.
Welfare KPIs: measure the horse, not the building
Facility checklists tell you what a yard has. Animal-based indicators tell you what the horse is experiencing. A 2025 study that assessed 737 racehorses across 74 yards in Great Britain used animal-based measures and found large differences between yards: 18% of horses had mouth corner lesions, 86% had forage present in the stable, and 27% had daily turnout.
Those figures are from British racing yards, not Australian ones, so treat them as a reminder of how much yards vary rather than as a benchmark for your own. The indicators themselves are what transfer:
- Forage available in the stable. A yes or no per horse, per day.
- Daily turnout. Count the days per week each horse gets time out, not whether a paddock exists.
- Social contact while stabled. Can the horse see or touch a neighbour?
- Human reactivity. A simple, consistent response test when staff approach.
- Mouth corner and body lesions. Logged when found, with the date.
- Body condition. Scored on a consistent scale. Our practical Henneke guide covers how to do it the same way each time.
Choose welfare KPIs your team believes in
Research validating a Thoroughbred welfare index in Australia, published in PMC, found that trainers already score highly on horsemanship and health (often 81 to 95% at the top level). The gaps sat in areas the industry rates as less important, such as stabling, heat stress and education. It also found that gear-related measures were poorly valued even though they are easy to count.
Two lessons follow. First, a KPI nobody respects will not be recorded properly. Second, your best return is often in the neglected area, not the one you already do well. If health checks are already excellent, adding more health metrics changes little. Heat management on a summer afternoon, or stall time per day, might.
A welfare KPI also supports your vet
Supplements, rehab progress and symmetry all feed the conversation with your veterinarian. Logging them consistently means a handoff takes minutes. Two relevant guides: supplement tracking in six steps for vet handoffs and rehab tracking that spots a 2% asymmetry earlier. If a horse is lame or off, the person to see is your veterinarian, not a dashboard.
Results KPIs: use them with care
Racing yards have a public scoreboard. Racing Australia publishes trainer premierships with wins, placings, prize money, strike rate and starts. These are fair outcome KPIs for a racing stable, and you can calculate your own the same way.
Treat them as lagging indicators. A strike rate tells you what happened over months. It cannot tell you why, and by the time it drops the cause is long past. Pair each outcome KPI with a leading one: if strike rate matters, watch training load consistency and recovery. For sport and performance horses, the equivalent outcomes might be scores, clear rounds or qualifying results, with the same rule applied.

Owner and syndicate KPIs
Owners are your customers, and their patience is a performance measure. Nobody enjoys a surprise invoice or learning about a vet visit three days late.
Subscription businesses use churn and renewal rates for this. SaaS benchmarks from Albion describe good performance as gross churn under 12% a year, logo churn under 7% and renewal rates above 90%. Those are software industry numbers, not yard standards, so do not copy them as targets. The method is what carries over:
- Owner retention. Of the owners you had twelve months ago, how many still have a horse with you?
- Horse retention. Of the horses in the yard a year ago, how many remain in your care, excluding planned sales and retirements?
- Net movement. Do new horses and added services from existing owners outweigh departures? The same report treats negative net churn as a high-performing signal.
- Update response time. How long from a vet visit or a fast work to the owner knowing?
For syndicates, add clarity measures: how long after month end are statements out, and how many queries come back per statement? A falling query count is a sign the numbers are being understood. Our piece on offline horse management software looks at how real-time updates cut owner phone calls.
Yard finance KPIs
Keep these few and plain:
- Cost per horse per week, including feed, supplements, farrier, vet and labour.
- Revenue per horse per week against that cost.
- Debtor days, meaning how long invoices sit unpaid.
- Feed cost trend. Feed is a lever you control. Compare feed plans against workload so you are not overfeeding a horse that has had a light week.
The workload balance guide shows how to link energy intake in steps of 20% to a seven-day log.
How to choose your four or five
The research on subscription performance points the same way: teams do better with a few indicators and agree internally on definitions before they report. For a yard, do it in this order.
- Name the problem. Injuries, owner turnover, cash flow, or inconsistent training? Pick the one that costs you most.
- Pick one KPI per area at most. For example: weekly load per horse, turnout days per week, owner renewal rate, cost per horse.
- Write the definition. What is measured, in what unit, by whom, at what time of day. "Turnout" means at least how many hours?
- Set the review. A 20-minute meeting on a set day, with the head rider, the manager and anyone who feeds.
- Decide the trigger. For example: a horse whose weekly load rises sharply gets a lighter day and a vet check if soreness appears.
- Collect a baseline first. Our benchmarking starter suggests one week of consistent data before you judge anything, and the weekly workflow keeps it going.
Common mistakes
- Measuring what is easy, not what matters. The Thoroughbred welfare study showed that easily counted items were not what the industry valued.
- Comparing horses with each other when you should compare each horse with itself. Individual progression is the point.
- Changing definitions mid-season, which makes trends meaningless.
- Collecting data in a notebook that only one person can read. If a vet or a relief rider cannot see it, it does not help in a crisis.
- Ignoring data quality. A noisy gallop trace is not a finding.
Our view: one record, few numbers, used weekly
We build for professional yards, and what we see in the way yards work is consistent: the problem is rarely too little data. It is data scattered across notebooks, group chats and spreadsheets, so no one can answer a simple question like "how has this horse's load changed over four weeks?" without an hour of digging.
Our position is simple. Put the horse record, the session data, the finance and the owner updates in the same place, and show people the few numbers that matter. That is why EquiBETS combines movement analysis, GPS ride tracking, nutrition and feed planning, owner portals and finance tracking in one workspace, and why the mobile app works offline, because the arena and the back paddock do not always have signal.

We also believe AI should be evidence-led. A movement or nutrition analysis is only worth acting on if you can see what it is based on and compare it with the horse's own history. And we think a yard should be able to share information with owners and vets without handing over everything. Privacy and clear, task-focused design matter more than another chart.
If you take one thing from this guide, make it the order of operations: define, record consistently, review on a schedule, then act. The tool matters less than that habit.
— isaac
Putting your KPIs in one place
EquiBETS Complete is a single plan with every module included, at A$9.99 per month, with a free trial before you subscribe. It covers unlimited horses and team members, so you can set up your four or five KPIs for the whole yard in one go. Start with one week of sessions and see which numbers you actually look at. You can find out more on the EquiBETS site.
FAQ
How many KPIs should a stable track?
Four or five is a workable ceiling for regular review. Subscription-sector analysis from EY found that high performers focus on a few indicators. Keep everything else as records in the horse's file and add a KPI only when a decision needs it.
What is the best KPI for horse training performance?
There is no single best one, but a repeatable standard test result is the strongest fitness measure, with weekly load as the explanation behind it. Exercise-testing research recommends using GPS and heart rate within a standardised protocol. Judge each horse against its own history.
How do you measure welfare in a stable?
Use animal-based indicators: forage access, daily turnout, social contact, human reactivity, lesions and body condition. A 2025 racehorse welfare study used this type of measure. Record them on a set day each week so changes show up.
How often should I review stable KPIs?
Load and welfare weekly, owner and finance measures monthly, and retention quarterly or yearly. A short, fixed meeting works better than an occasional long one. Review the trend, not a single day's number.
Sources
- The use of exercise testing to assess training efficacy, Equine Veterinary Education
- Technologies for equine welfare and performance monitoring under field conditions, Equine Veterinary Journal
- Welfare assessment of racehorses provides a baseline for continued monitoring, PMC
- Validating a Thoroughbred Racehorse Welfare Index, PMC
- Racing Australia trainer premiership tables
- SaaS benchmarks, Albion VC (PDF)
- Four actions for subscription software companies, EY (PDF)