
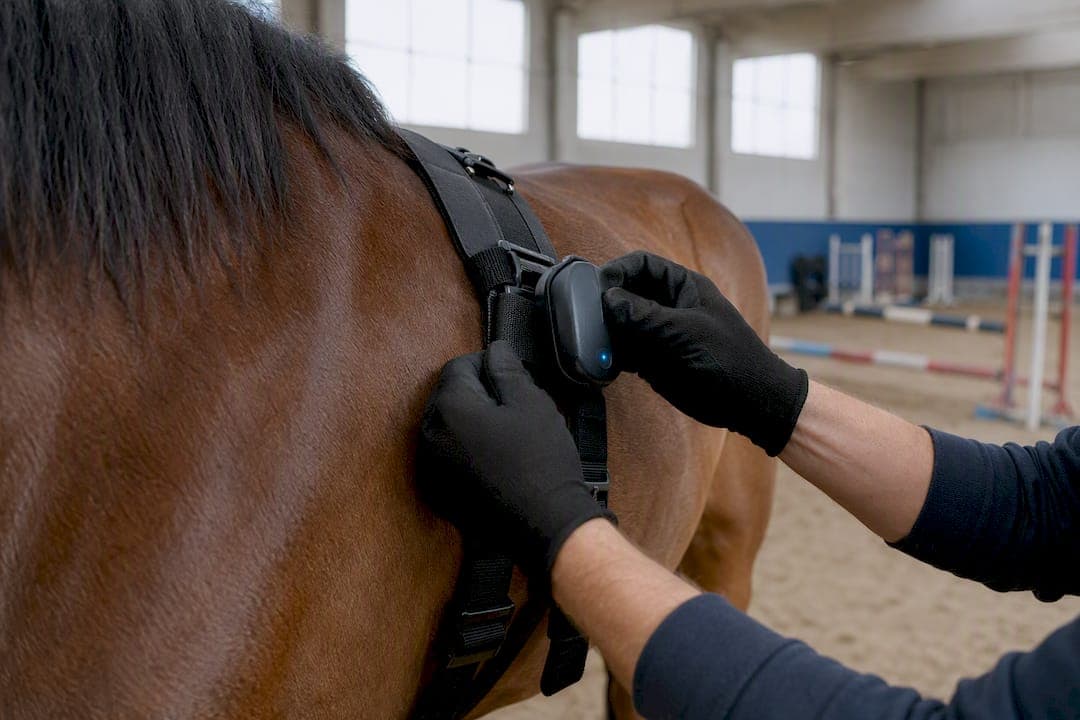
Align session type, footing and rider before comparing anything else, then read heart rate, GPS speed and duration against the horse's own baseline, not a stable average. Done this way, a comparison flags fitness gains, stalled recovery or brewing fatigue within a week or two rather than months. The setup and interpretation rules below turn that single principle into a repeatable weekly habit.
TL;DR:
- Comparing sessions of different types or under different conditions can be misleading; focus on multiple consistent, objective metrics within comparable contexts.
- Tracking fitness or recovery trends is most effective when analyzing longitudinal data over a period, rather than individual sessions in isolation.
- Heart rate, speed, and lactate levels provide more reliable insights when measured against each horse’s own baseline, not against population averages.
- Adjust training based on patterns like rising heart rate or lactate, reducing workload or increasing rest to prevent fatigue or injury.
- Using a centralized platform that consolidates session data, tagging, and baselines can streamline comparisons and improve training decision-making.
Table of Contents
- What a valid comparison looks like: fields and metrics you can trust
- When comparing sessions actually pays off
- How to set up an apples-to-apples session comparison
- Reading heart rate, speed and workload correctly
- Turning what you see into a training decision
- How EquiBETS makes this comparison workflow practical
- A Monday to Saturday routine that actually uses this data
- Compare sessions faster with EquiBETS
- Sources
What a valid comparison looks like: fields and metrics you can trust
Not every pair of sessions is worth comparing. A hack around the paddock on a wet Tuesday tells you nothing set against a flatwork session on firm ground the following Saturday, because the variables are stacked against you before the data even loads.
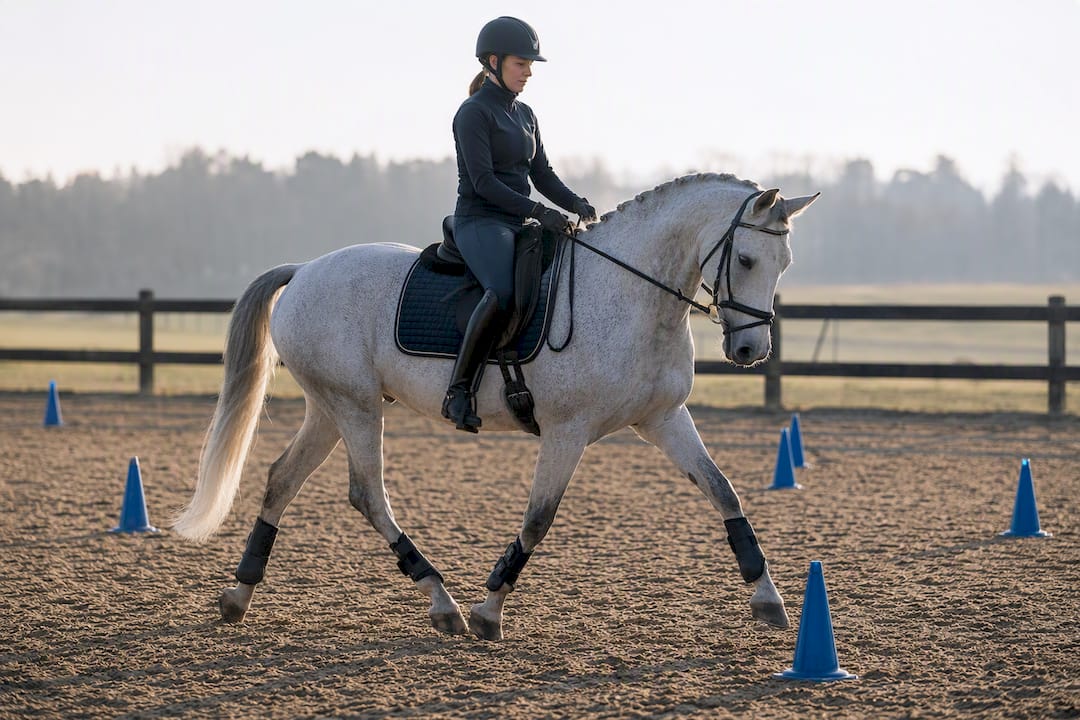
Get the metadata right first. Every session worth logging needs a date and time, a session type, footing or arena surface, ambient conditions, and who was in the saddle, because a substitute rider alone can shift heart rate by several beats without any change in fitness.
From there, prioritise objective numbers over impressions:
- Heart rate at rest, peak, and during recovery
- GPS speed metrics, including best 200 metre time and full velocity profile
- Session duration and gait time share (how long spent walking, trotting, cantering)
- Lactate readings, where testing equipment is available
- A short subjective report card plus video notes for context
Sensor data confirms what happened physically; the report card explains why. A practitioner-recommended report card approach that pairs numbers with notes catches issues a single spreadsheet column never will.
When comparing sessions actually pays off
Comparison work earns its keep in four specific situations, and it wastes time everywhere else.
- Tracking fitness progress across a build phase, using the same test session repeated every few weeks.
- Return to work after injury, where recovery HR and gait balance need to climb back toward pre-injury numbers gradually rather than all at once.
- Benchmarking against a reference session that preceded a strong competition result, so you have a target profile rather than a guess.
- Spotting fatigue trends before they become lameness or a training plateau.
Comparing a hill-work canter session to an arena dressage school will mislead you every time, because footing, gait share and cardiovascular demand differ too much to isolate cause from noise. Longitudinal views, where you pull a date range rather than two isolated days, smooth out one-off anomalies like a windy day or a spooky corner and let real trends surface.
How to set up an apples-to-apples session comparison
Start by naming the goal: benchmark against a past win, check recovery after time off, or track a fitness build. That decision shapes every filter you apply next.
- Pick sessions of the same type (flatwork, jumping, conditioning) on comparable footing and intensity.
- Or switch to a date-range view for longitudinal comparison instead of picking two sessions by hand.
- Filter by gait breakdown, intensity band, and note any rider or tack changes that might skew the numbers.
- Tag each session by discipline, since a dressage school and an endurance conditioning ride should never sit in the same comparison set.
If the data looks noisy, before assuming the horse changed, check whether the rider, surface or weather did. A missing GPS signal under tree cover or a dropped heart rate strap reading often explains a weird spike far better than a fitness story does.
Pro Tip: Keep one "reference session" pinned per horse, ideally one that preceded a strong performance, and measure every future session against that specific baseline rather than a rolling average.
Reading heart rate, speed and workload correctly
Numbers only mean something once you know which direction of movement matters.
For heart rate, watch three things: peak value, average across the session, and the recovery slope afterward. A BEVA review of exercise testing confirms that heart rate and lactate-derived indices such as VLA2 and VLA4 remain among the most reliable ways to judge whether a training programme is working, provided they're read against an individual horse's own baseline rather than a generic standard.
- A sustained upward shift in peak or average HR at the same workload usually signals declining fitness or accumulating fatigue.
- Best 200 metre time and average velocity falling off, with more high-intensity bursts needed to hit the same pace, points the same direction.
- Gait time share matters as much as speed. More time spent walking to achieve the same session length can mean the horse is compensating for something.
- Rising lactate at a speed that used to produce a lower reading is one of the clearest fatigue markers available, when testing kit is on hand.
A small controlled comparison of early saddle-training methods recorded peak heart rates of 127 bpm against 176 bpm between two handling approaches in just 14 horses. It's a small sample, but it shows how much method alone can move the numbers before fitness enters the picture at all.
Turning what you see into a training decision
A comparison is only useful once it changes what happens in the next session.
- If the trend is upward (faster times, steadier HR, quicker recovery), progress the load gradually: add a small increment, then build in a genuine recovery day before pushing further.
- If HR or lactate is climbing at the same intensity, pull back the workload and add rest days before the trend becomes an injury.
- When the data is ambiguous, a standardised exercise test resolves the guesswork better than another ordinary training session will.
- Log every adjustment directly against the session, so the next comparison carries the context of what changed and why.
A common microcycle tweak looks like trimming canter intervals from four sets to three for a week, or swapping a hard conditioning day for a light hacking session, based purely on a recovery slope that's stopped improving.
Pro Tip: Note the reason for every training change next to the session data itself. Six months later, "reduced load, elevated recovery HR" tells you far more than a blank field ever will.
How EquiBETS makes this comparison workflow practical
Everything above depends on clean, comparable data being easy to pull up, and that's the part most yards struggle with when session notes live across three notebooks and a phone's camera roll. EquiBETS consolidates session logs, GPS tracking and heart rate visualisations into one workspace, with baselines that carry forward automatically so a new session lands against its proper reference point rather than a blank screen.
Offline mobile access means data still gets captured in the far paddock with no signal, and owner portals keep clients updated without a separate phone call. For yards running multiple horses across different disciplines, the stable manager tools keep filters, discipline tags and team permissions organised so a jumping session never gets compared against a dressage school by accident.
A Monday to Saturday routine that actually uses this data
A typical week might run a standardised test Monday, two conditioning or skill sessions midweek, then a Saturday review pulling all three against last month's baseline. Sensor trends, a quick rider report card and a video clip usually agree. When they don't, that's the signal worth chasing. One yard I know trimmed canter sets after three Saturdays showed recovery HR creeping up despite unchanged times.
— isaac
Compare sessions faster with EquiBETS
If you've been running these comparisons in a spreadsheet, the setup above becomes a lot less painful once the filtering, tagging and baseline tracking happen in one place instead of three. EquiBETS was built specifically for professional yards juggling multiple horses across disciplines, combining AI-powered movement analysis with offline mobile logging so nothing gets lost between the arena and the office.

Every session, from a standardised test to a Saturday hack, gets tagged, timestamped and stored against the right horse's baseline automatically, and the stable manager tools keep discipline filters and team access sorted without extra admin. Support is built around onboarding professional yards rather than solo hobby setups. Start a trial at the EquiBETS pricing page and see how quickly your own comparisons start throwing up something worth acting on.
Sources
- The use of exercise testing to assess training efficacy in sport horses (BEVA review, 2026-02-15)
- Comparison of Monty Roberts technique versus conventional UK technique (Pirbright publication)