
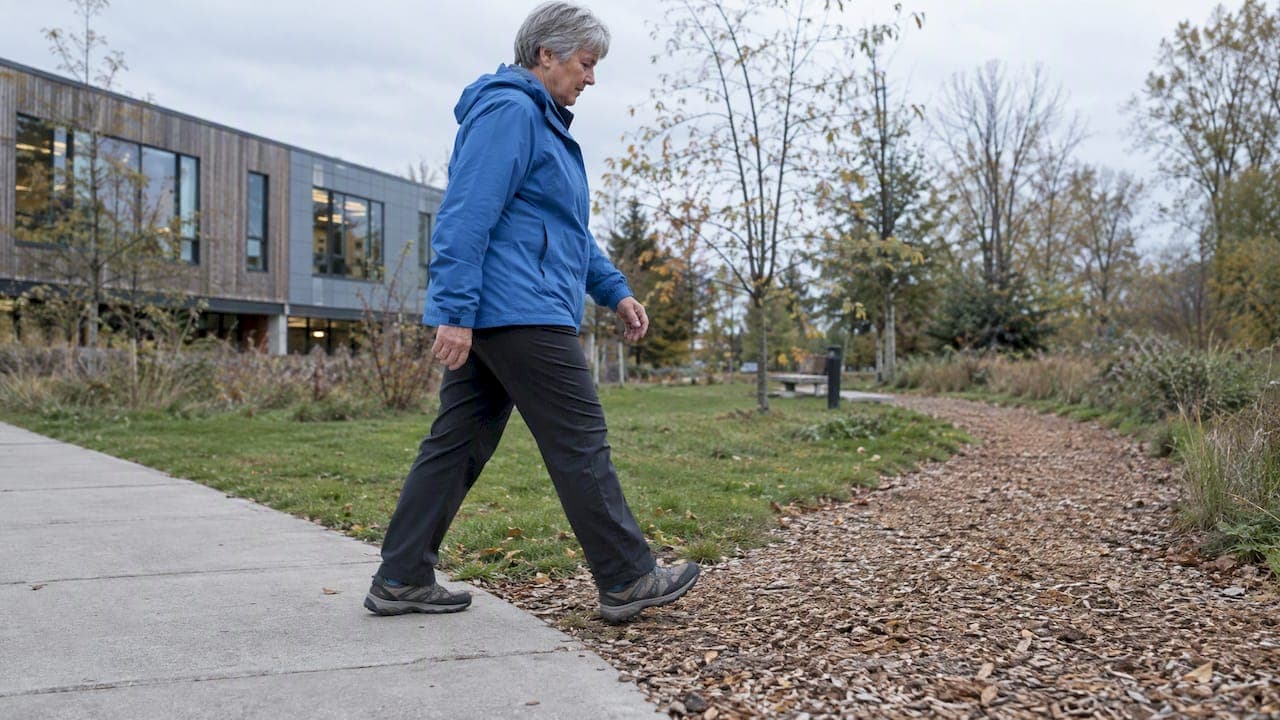
Uneven, compliant and sloped surfaces can affect gait variability and step and kinematic measures. Compliant surfaces such as sand produce high gait variability, while walking on woodchips has a higher energy cost than walking on a sidewalk. Slopes leave a recognisable signature in vertical ground reaction force and centre of pressure data. Older adults and people after stroke are affected most.
TL;DR:
- Woodchip walking costs about 27% more energy than sidewalk walking, while virtual clearance and lateral swing variability help predict metabolic cost in field measurements.
- Older adults often slow down on uneven terrain to limit head movement, while people after stroke show slower gait and greater mediolateral trunk acceleration.
- Clinicians should compare an uneven or compliant trial with results from a flat floor, because walking speed alone can miss everyday difficulties.
- A review of 384 studies recommends reporting a surface description, photograph, length, width, and slope; friction, compliance, and roughness measures improve comparisons.
- Pressure insole force curves can usually distinguish slopes from compliant ground, but they struggle to identify which compliant surface a person walked on.
Table of Contents
- Which surface types change gait, and in which direction?
- What spatiotemporal, kinematic and energetic outcomes shift?
- How do older adults and people after stroke respond differently?
- How do measurement methods record the surface?
- Why is surface reporting so poor, and what should studies include?
- Our perspective: treat the surface as data, not background
- FAQ
- Sources
Which surface types change gait, and in which direction?
Researchers often group surfaces by characteristics such as unevenness, compliance, slope and slipperiness, and these characteristics can affect gait.
- Uneven or rough surfaces: small-scale height variation, such as cobbles or irregular paving. Healthy adults lower their centre of mass and increase hip and knee flexion to absorb perturbations, while pelvic accelerations rise.
- Compliant surfaces: sand, grass and other soft substrates. Gait variability climbs, and ankle stiffness has to increase to hold mid-stance stable.
- Slopes: uphill and downhill walking. Downhill walking produced some of the largest effect sizes in insole data.
- Slippery surfaces: low-friction conditions. Friction measurement here is itself uncertain, which we return to later.
The direction and magnitude of effects can vary across studies. Magnitude depends on design, including footwear, walking speed and how the surface was described.
What spatiotemporal, kinematic and energetic outcomes shift?
Studies track a familiar set of outcomes, and surface change moves most of them.
- Spatiotemporal: walking speed may fall, and step length, width and timing may change, often as part of a cautious pattern.
- Kinematic and kinetic: virtual clearance and stride variability differ across field terrains, ankle moment and stiffness rise on compliant ground, and VGRF measures can vary with slope.
- Stride metrics: field IMU work shows that virtual clearance and lateral swing variability help predict metabolic cost.
On energy, the same field study ranked terrains from sidewalk through dirt, gravel and grass to woodchips. Cost rose steadily along that sequence.
Woodchips cost about 27% more energy than sidewalk, so even a modest change in ground texture carries a real metabolic price over a long walk.
Loose sand sits at the far end of this spectrum. Because it also produced the highest gait variability of any compliant surface studied, it makes a useful stress test when you want to see how robust a participant's gait control is.

How do older adults and people after stroke respond differently?
The same surface demands land harder on people with reduced reserve.
- Older adults: they slow down on uneven terrain as an active strategy to keep head movement tolerable, and their trunk accommodation, a key stabiliser, is impaired compared with younger adults.
- After stroke: gait speed falls and mediolateral trunk acceleration rises, and compensatory strategies may not fully restore safety margins.
- Muscle and joint changes: compared with healthy controls, people after stroke show decreased hip extension in stance and longer ankle plantarflexor activity in swing on uneven ground.
- Activity link: in one post-stroke cohort, longer paretic steps on an uneven surface went with higher daily step counts (r = 0.65, p = 0.012).
The practical consequence is that a flat, rigid laboratory floor can understate the difficulty someone faces in the community. Uneven-surface testing belongs in the assessment, not only in research protocols.
Pro Tip: Add one uneven or compliant walking condition to your routine assessment and compare it against the flat-floor result, rather than relying on speed alone.
How do measurement methods record the surface?
The instruments you choose to determine what you can say about the ground underfoot.
- VGRF and COP: slopes and compliance change which peaks shift and how the curve sloped between them. Instrumented insoles showed the greatest variability on sand.
- What insoles and IMUs can separate: VGRF curves can usually identify slope versus compliance, but telling one compliant surface from another is difficult.
- Annotate the dataset: record the inferred or known surface type alongside every wearable trial.
- Estimate slope: a simple slope estimate from IMU data helps separate inclined from flat walking.
- Correct before interpreting: adjust for surface-induced variability before drawing clinical conclusions from wearable data.
For video-based capture, our guide to gait video setup for clinics covers recording practice that carries over to any gait workflow.
Why is surface reporting so poor, and what should studies include?
A systematic review of 384 studies found that most gait studies describe their surfaces inadequately. Without a usable description, comparing results from different studies is difficult, and a finding about "uneven ground" may refer to quite different terrain.
The reviewers recommend, at minimum:
- A verbal description of the surface.
- A photograph.
- Surface length.
- Surface width.
- Surface slope.
Ideally, studies also add standard measures of friction, compliance and roughness, plus 3D models. Experts further suggest combining physical measures such as local slope with perceptual ratings of stability and roughness.
| Reporting tier | Descriptor |
|---|---|
| Minimum | Verbal description, photograph, length, width, slope |
| Aspirational | Friction, compliance and roughness measures, 3D models |
These items can help make a study more reproducible and let a reader interpret wearable-collected data in context.
Our perspective: treat the surface as data, not background
The ground is a variable, and most gait datasets still treat it as scenery. If you change one habit, make it this: describe the surface as carefully as you describe the participant. A trial whose route was never photographed or measured can be difficult to interpret later.
- Write the surface into your metadata for every trial.
- Photograph the route and record slope and length.
- Tag each trial as compliant or non-compliant.
- Report uncertainty in any friction readings.
- For rehabilitation or prosthetic testing, consider the Variable Stiffness Treadmill 2, which gives a reproducible compliant terrain in the lab.
Pro Tip: Report your tribometer technique and uncertainty, because single-user variance underestimates the true uncertainty of friction testing.
For yards and clinics turning movement data into usable records, we cover the workflow in our piece on horse movement analysis for clinicians, and our rehab progress metrics show how disciplined reporting supports change detection.
— isaac
FAQ
Which surfaces change gait the most?
Compliant surfaces such as sand change gait substantially, raising variability and ankle demands. Downhill walking also produces prominent effects. Findings from pressure insole data support the conclusion that slopes and compliance affect gait.
How does surface type affect gait variability?
Softer and less regular ground raises step-to-step variability because the body must keep adjusting foot placement and joint stiffness. Sand showed the highest variability among the compliant surfaces compared.
Why should clinicians test on uneven ground?
Flat, rigid floors can hide difficulties that appear in everyday environments. After stroke, uneven ground reduces gait speed and increases trunk acceleration, so an uneven condition gives a more realistic picture.
What should a study report about its walking surface?
At minimum, give a verbal description, a photograph and the surface's length, width and slope. Adding friction, compliance and roughness measures improves comparability, as the systematic review recommends.
Sources
- Pmc
- A systematic review of the measures that have been used to assess surface characteristics in relation to their impact on walking and falling
- Frontiers | The walking surface influences vertical ground reaction force and centre of pressure data obtained with pressure-sensing insoles
- Walking on uneven terrain in healthy adults and the implications for people after stroke
- Human walking in the real world: Interactions between terrain type, gait parameters, and energy expenditure - PMC
- Effect of Walking Adaptability on an Uneven Surface by a Stepping Pattern on Walking Activity After Stroke