
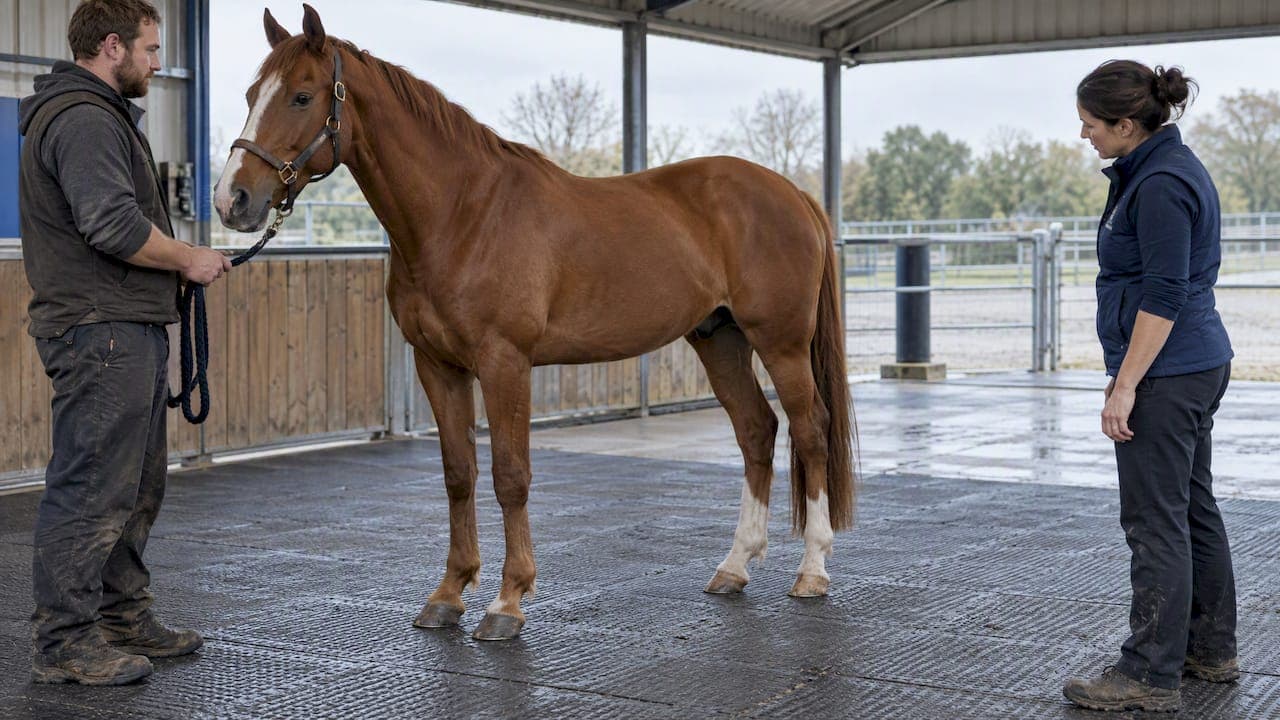
Commonly used thresholds sit around 6 mm for head asymmetry and 3 mm for pelvic asymmetry at trot in a straight line, but these raw numbers are starting points rather than diagnoses. ROC-derived cut-offs for pelvic parameters can run considerably higher depending on the sensitivity or specificity you prioritise, and a large share of horses perceived as sound exceed these figures anyway. Treat any single measurement as a clinical decision limit that needs corroboration, not a verdict.
TL;DR:
- Measurement thresholds like 6 mm for head asymmetry and 3 mm for pelvic asymmetry are reference points, not definitive diagnoses, as many sound horses exceed these values.
- Different systems, such as inertial sensors and optical motion capture, process data differently, making threshold comparisons across platforms unreliable without system-specific verification.
- Raising thresholds increases specificity but risks missing subtle asymmetries, while lowering thresholds enhances sensitivity but may produce more false positives.
- Many horses exceed these thresholds without being considered lame, especially when stride variability is high, so corroborating with history and repeated measures is essential.
- Objective asymmetry data should be interpreted within a clinical context and baseline over time, rather than from single-session measurements alone.
Table of Contents
- Commonly reported thresholds by parameter
- Why thresholds differ between measurement systems
- Sensitivity, specificity and the grey zone between sound and lame
- Asymmetry is common in horses nobody calls lame
- A measurement protocol clinicians can trust
- Where threshold interpretation goes wrong
- How longitudinal records support better threshold decisions
- A pragmatic view on objective asymmetry metrics
- Getting the workflow into daily practice
- Sources
- FAQ
Commonly reported thresholds by parameter
Clinicians working with objective gait systems encounter a recurring set of reference values, even though the exact figures shift with context. For straight-line trot, head movement parameters (HDmin/HDmax) and pelvic movement parameters (PDmin/PDmax) carry the most widely cited defaults.
- Head asymmetry (HDmin/HDmax): approximately 6 mm is the commonly applied threshold for straight-line trot, as used in the prevalence study of high-performing riding horses.
- Pelvic asymmetry (PDmin/PDmax): approximately 3 mm is the comparable default for pelvic movement in the same population.
- Severity bands reported in the literature typically double for each category, so a mild vertical displacement asymmetry in the 8.5 to 17 mm range might be classed moderate, with hindlimb-specific bands often falling in the 3 to 6 mm zone depending on the parameter.
- ROC-derived pelvic cut-offs for upward movement (PDUp) have been identified at roughly 7.5 to 12.5 mm, with the exact figure depending on whether the benchmark favours sensitivity or specificity, as reported in the smartphone-based pelvic asymmetry study.
These bands are reference points for interpretation, not fixed boundaries between sound and lame.
Why thresholds differ between measurement systems
Thresholds published for one system rarely transfer cleanly to another. Inertial measurement unit (IMU) devices such as Lameness Locator, optical motion capture rigs and markerless AI pipelines process raw motion data differently, and some IMU outputs report "corrected" millimetres adjusted for harmonic amplitude rather than the real-world displacement that optical systems record. A review of inertial sensor technologies notes that sensor count, axis configuration and processing pipeline all shape the final number, which is part of why a 6 mm cut-off on one system is not interchangeable with 6 mm on another.
- IMU systems often output corrected values; optical and markerless systems tend to report raw displacement, and conversion between the two introduces uncertainty.
- PDUp frequently shows stronger discriminative power for hindlimb lameness, while HDmin/HDmax remain the standard reference for forelimb sidedness and timing.
- Small differences in how a parameter is defined (peak timing, stride phase, filtering) can flip which limb appears more affected.
Pro Tip: Always check which parameter definitions and correction factors a report uses before comparing it against a published threshold from a different system.
Sensitivity, specificity and the grey zone between sound and lame

Every threshold is a trade-off. Raising the cut-off to achieve higher specificity reduces false positives but risks missing genuinely asymmetric horses, while prioritising sensitivity catches more cases at the cost of flagging sounder horses. The smartphone pelvic asymmetry study demonstrates this directly with AbPDUp cut-offs shifting between roughly 7.5 and 12.5 mm depending on whether the benchmark specificity was set near 75% or higher.
A sourced figure: clinical decision limits are deliberately distinct from reference intervals; they are built to prompt action in a clinical population rather than describe a healthy one, and incorporating an equivocal grey zone between positive and negative avoids forcing every result into a binary call.
- Screening contexts favour higher sensitivity, accepting more false positives to avoid missing subtle asymmetry.
- Confirmatory work favours higher specificity and should be paired with diagnostic analgesia before a diagnosis is finalised.
Asymmetry is common in horses nobody calls lame
A large proportion of horses never flagged as lame by their owners still register above standard thresholds on objective systems. The PLOS One prevalence study measured 114 to 123 high-performing riding horses and found around 69 to 70% exceeded the 6 mm head or 3 mm pelvic thresholds at straight-line trot, with a meaningful subset exceeding double those values, figures usually seen in clinically lame horses.
This is the clearest argument against reading any single number as a diagnosis. Context matters as much as magnitude:
- Stride-by-stride standard deviation (SD) relative to the mean is informative: when SD is high relative to the mean, variability is a more plausible explanation than a consistent pathological pattern, a pattern highlighted in cross-system field comparisons.
- A horse sitting just above threshold with high stride variability needs a different conversation than one sitting well above threshold with a tight, consistent SD.
- Corroborate any above-threshold reading with history, ridden assessment, repeat measurement sessions and, where indicated, diagnostic analgesia before concluding there is a problem.
Asymmetry and pain overlap, but they are not synonyms.
A measurement protocol clinicians can trust
Reliable interpretation starts with a disciplined capture protocol, since most disagreements near a threshold trace back to how the data was collected rather than to the horse itself.
- Capture a minimum of 25 to 30 strides where practical; shorter samples inflate the influence of a single awkward step on the mean.
- Use straight-line trot on a firm, level, consistent surface as the default protocol, and switch to circle-specific indices and thresholds when lunging, since circle work induces its own physiological asymmetry that straight-line thresholds do not account for, as shown in research on circle-induced asymmetry.
- Check sensor placement and calibration before each session, then review the stride list for obvious outliers (a stumble, a head toss) before trusting the mean.
- Examine the SD alongside the mean rather than reporting the mean in isolation.
- Keep baseline records for each horse on the same surface and protocol so later sessions are genuinely comparable, and escalate to diagnostic analgesia or imaging when repeat measures stay consistently above the system's clinical decision limit.
Pro Tip: A single trot-up tells you where a horse stands today; a baseline record tells you whether today is unusual for that horse.
Where threshold interpretation goes wrong
A handful of recurring mistakes account for most threshold misclassification in practice.
- Applying a threshold validated on one system to data from a different system, ignoring the corrected-versus-raw millimetre distinction.
- Drawing conclusions from a small stride sample instead of the 25 to 30 strides needed for a stable mean.
- Reading the mean while ignoring a high SD that signals variability rather than a consistent gait fault.
- Using straight-line thresholds on circle data, where physiological asymmetry is expected.
The recommended workflow is straightforward: quantify asymmetry, compare it against the system-appropriate clinical decision limit, repeat the measurement across sessions, then integrate the result with targeted clinical tests. Lesion-specific and longitudinal threshold studies remain thin, which is reason enough to treat any single session cautiously.
How longitudinal records support better threshold decisions
Comparing one trot-up against a population threshold tells you less than comparing a horse against its own history. Platforms that store trot traces over time, visualise stride-by-stride SD, and allow offline capture in the field give clinicians a practical way to build that baseline, while owner portals add corroborating context on ridden behaviour and recent changes at home. A trend showing gradually rising asymmetry with tightening SD is a more useful trigger for diagnostic analgesia than a single borderline reading.

Clinicians should still validate any platform's sensor processing against system-specific clinical decision limits rather than treating a platform's own output as an already-validated research-grade threshold.
A pragmatic view on objective asymmetry metrics
Objective numbers are tools, not verdicts. The horses that cause the most confusion are the ones sitting just above a published threshold with high stride variability, and no cut-off resolves that ambiguity on its own. Build a baseline for every patient, bring owners into the monitoring loop, and keep pushing for standardised, lesion-specific validation work across systems.
— isaac
Getting the workflow into daily practice
This platform provides yards and clinicians a way to store trot traces, track asymmetry trends alongside stride variability, and capture data offline when connectivity is limited. Owner portals keep ridden history and day-to-day observations attached to the same record, so a borderline reading arrives with context rather than in isolation.

It is not a substitute for a validated research-grade system, but as a longitudinal record it makes repeat comparison far less effort than chasing paper trot-up notes. Check current pricing and trial access to see whether it fits your yard's workflow.
Sources
- Prevalence of movement asymmetries in high-performing riding horses perceived as free from lameness and riders’ perception of horse sidedness | PLOS One
- Smartphone-Based Pelvic Movement Asymmetry Measures for Clinical Decision Making in Equine Lameness Assessment | MDPI Animals
- Objective movement asymmetry in horses is comparable across systems but threshold differences drive classification discrepancies | PMC
- Inertial Sensor Technologies—Their Role in Equine Gait Analysis, a Review | Sensors
- Deciphering reference intervals and clinical decision limits in equine endocrine diagnostic testing | ScienceDirect
FAQ
What is the 1/2/3 rule for horses?
This phrase is not a standardised asymmetry threshold in the gait analysis literature discussed here; definitions vary by context and source. If you encountered it in a different setting, such as feeding or conditioning, it is unrelated to the head and pelvic asymmetry thresholds covered in this article.
What is the 20% rule for horses?
The 20% rule is a weight-carrying guideline, not a movement asymmetry threshold: it suggests a rider's load should generally stay under roughly a fifth of the horse's body weight, as outlined by the University of Minnesota Extension. It is a management guideline with caveats around conformation and fitness, separate entirely from the gait symmetry thresholds discussed above.
What is ballerina syndrome in horses?
This is not a recognised clinical term supported by the sources reviewed here, and no standardised definition exists in the asymmetry literature covered in this article. If you have seen it used informally, it is best clarified directly with the person or source who used it.
What does it mean if a horse has an asymmetrical pelvis?
An asymmetrical pelvic movement reading means the pelvis moves up and down unevenly between left and right hindlimb stance phases, commonly assessed through the PDmin/PDmax or PDUp parameters. On its own this is common even in horses perceived as sound, with a high proportion of high-performing horses exceeding typical thresholds in one prevalence study, so it needs to be interpreted alongside stride variability, history and clinical examination rather than read as an automatic sign of hindlimb lameness.