
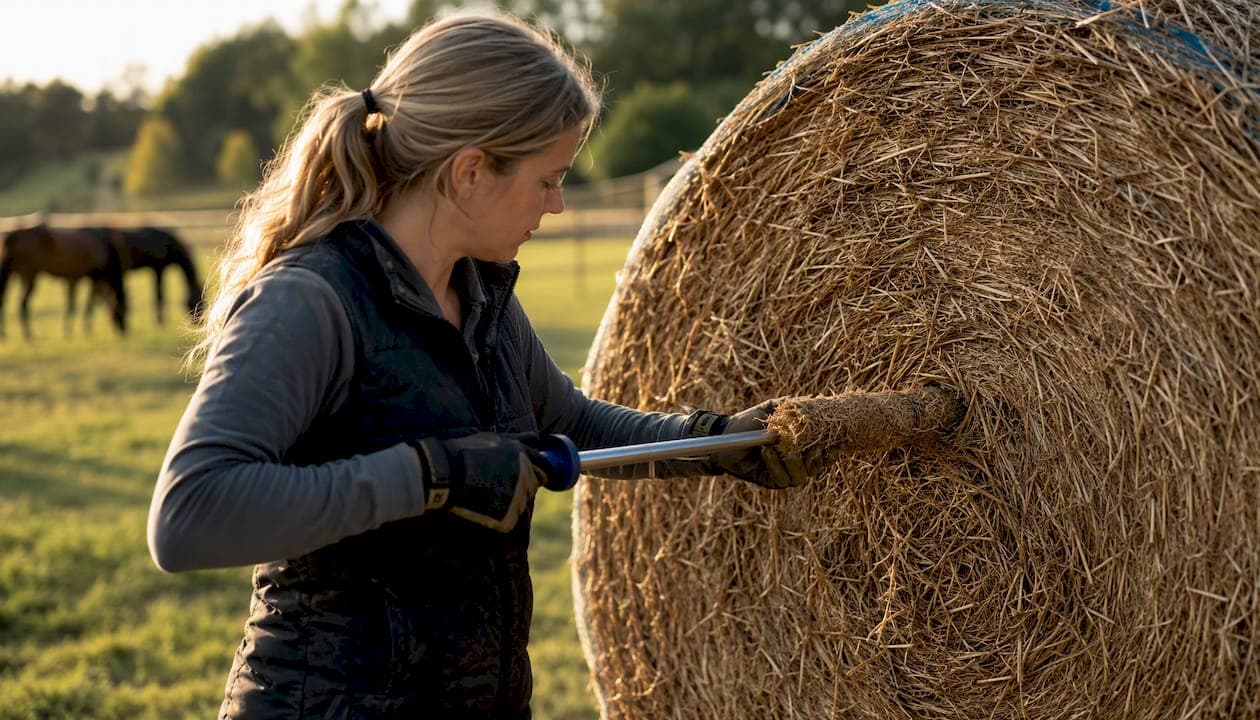
A hay analysis tells you the exact nutrient profile of what your horses are eating — and the first thing to do when a report lands in your hands is open the dry matter (DM) column, not the "as sampled" column. If any horse in your barn has metabolic concerns, check the NSC figure before anything else.
Here's what to do in the first five minutes with a new report:
- Open the DM column. The DM column removes moisture from the equation so you can compare this hay to any other batch or to your horse's nutrient targets without distortion.
- Check NSC immediately for at-risk horses. For horses with equine metabolic syndrome (EMS) or a laminitis history, the target is NSC below a low double-digit percentage. A number above that is a feeding decision, not just a data point.
- Flag moisture, then file the report by lot. Moisture above 17% signals mold risk; below 10% means brittle, dusty hay. Save the report tagged to the specific load so you can track trends over time.
Red flags that require immediate action: moisture above 17%, NSC above 12% for any metabolic horse, and calcium-to-phosphorus ratios outside a 1:1–2:1 range.
Key Takeaways
A hay analysis is only useful when you read the DM column, check NSC for at-risk horses, and connect the result to a specific lot and a specific feeding decision.
| Point | Details |
|---|---|
| Always use the DM column | The dry matter column removes moisture variation so you can compare batches and balance rations accurately. |
| NSC threshold for metabolic horses | Target NSC below 10–12% for horses with EMS or laminitis; soak hay or change sources if the result exceeds this. |
| Sample with a corer, not by hand | Core 10–20% of bales per lot, never mix loads or cuttings, and label each sample with source and cutting number. |
| Retest each new lot | Test new loads early to guide feeding for months; spot-check every 3–4 lots from the same supplier. |
| Equibets for lot-level tracking | Equibets' nutrition module stores lab results by lot, calculates NSC, and links results to individual horses for ongoing monitoring. |
Table of Contents
- Why should you test hay for your horses?
- What do all those abbreviations on a hay report actually mean?
- NIRS vs. wet chemistry: which lab method should you request?
- How to collect a hay sample that actually represents the bale
- What ranges should you expect, and what do they mean for different horses?
- How to use a hay analysis to adjust your feeding program
- How to choose a forage lab and what to request
- Common mistakes that make your hay analysis worthless
- Tools and software that help you act on hay analysis data
- An editorial perspective on hay analysis in daily yard management
- Equibets makes hay analysis part of your yard's daily workflow
- Sources
Why should you test hay for your horses?
The short answer: you cannot see nutrients. A flake of hay that looks green and smells clean can still be low in protein, high in sugar, or deficient in key minerals. Visual appraisal cannot accurately predict nutrient value, and that gap matters most when you're feeding horses with specific needs.
The use-cases where hay analysis changes real decisions:
- Metabolic horses and laminitis management. NSC control is as much a medical intervention as a nutritional one. Without a lab number, you're guessing at the most consequential variable in that horse's diet.
- Easy keepers and weight control. High-DE hay fed to an overweight horse adds calories you didn't intend. A test tells you whether to restrict quantity, soak, or switch sources.
- Performance horses and growing horses. These animals need adequate crude protein and digestible energy. Hay that looks mature and steamy often falls short on both.
- Broodmares in late gestation and lactation. Calcium, phosphorus, and protein requirements spike; hay that's fine for a maintenance horse may leave a broodmare deficient.
The cost argument is simple. A basic hay analysis runs at a modest cost, which is less than a single bag of supplement you might not need. Testing early in a new load guides feeding decisions for months, and if you buy frequently from the same supplier, spot-checking every 3–4 lots keeps you current without testing every delivery.
What do all those abbreviations on a hay report actually mean?
Reports from labs like Equi-Analytical or Dairy One can look like alphabet soup the first time. Here's what each term means and why it matters.
As sampled vs. dry matter
Every report has two columns. "As sampled" includes the moisture in the hay; "dry matter" strips it out. Always use the DM column for ration balancing. Comparing as-sampled figures between two hay batches with different moisture levels produces inconsistent supplementation decisions.
Crude protein (CP)
CP estimates the total nitrogen in the hay, converted to a protein equivalent. Maintenance horses typically need hay in the 8–10% CP range on a DM basis. Performance horses, growing horses, and lactating mares often need 12–16% or higher, depending on the stage of work or production.
ADF and NDF
Acid detergent fiber (ADF) and neutral detergent fiber (NDF) measure different fractions of the plant cell wall. ADF correlates with digestibility: lower ADF means more digestible hay. NDF relates to how much a horse will voluntarily eat: higher NDF tends to reduce intake and palatability. ADF under 45% and NDF under 65% are generally considered good targets for horses.
NSC, WSC, ESC, and starch
Non-structural carbohydrates (NSC) is the number that matters most for metabolic horses. Labs typically report ESC, WSC, and starch separately; estimate NSC by adding WSC plus starch. WSC (water-soluble carbohydrates) is the fraction most readily absorbed in the small intestine and the one most directly linked to insulin response. ESC is a subset of WSC. Starch is digested enzymatically in the small intestine. For horses with EMS or laminitis history, target NSC below 10–12%.
Digestible energy (DE)
DE, expressed in Mcal per pound or per kilogram, tells you the caloric density of the hay. Typical grass hay runs 0.75–0.90 Mcal/lb on a DM basis; legume hays like alfalfa can reach 1.0 Mcal/lb or higher. A horse gaining unwanted weight on hay that looks modest in quantity is often eating high-DE hay.
Minerals
The minerals most worth watching are calcium (Ca), phosphorus (P), potassium (K), magnesium (Mg), and selenium (Se) where relevant. The Ca:P ratio should stay between 1:1 and 2:1; inverting that ratio over time can cause developmental problems in young horses and bone issues in adults. Which minerals appear on your report depends partly on which tests you ordered.
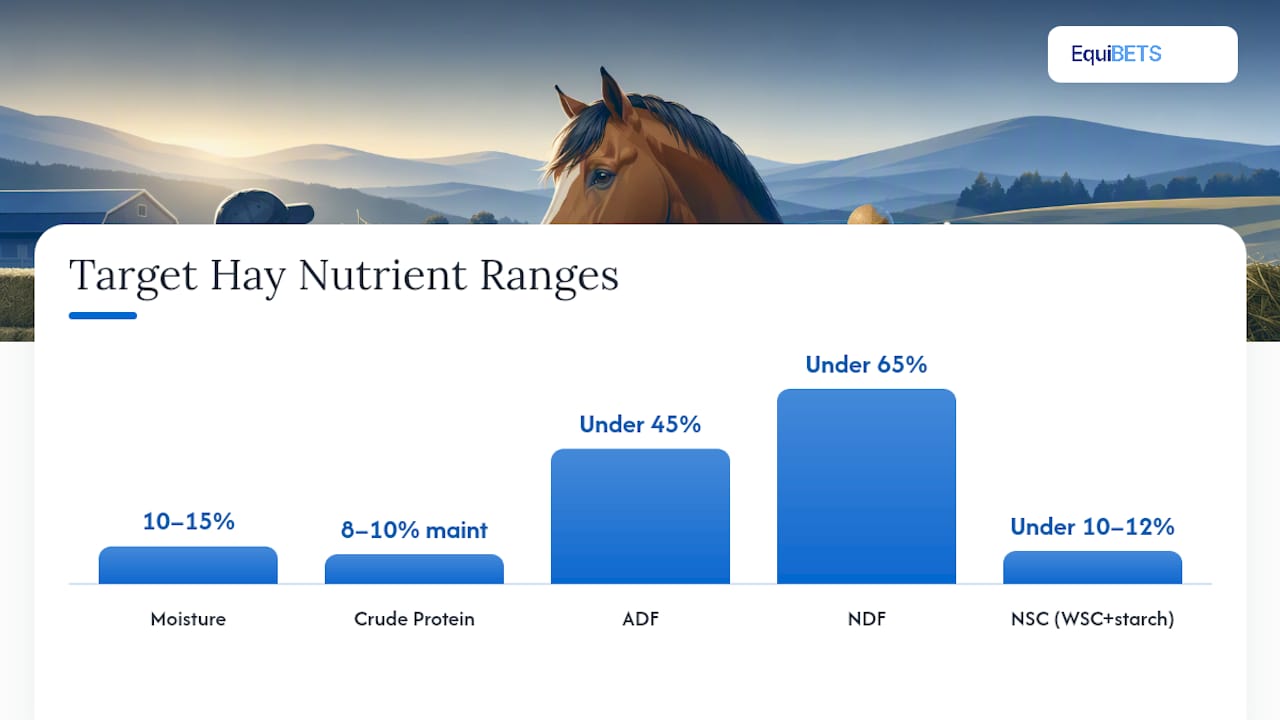
| Metric | What it measures | Target range (DM basis) |
|---|---|---|
| Moisture | Water content | 10–15% |
| Crude Protein | Nitrogen-based protein estimate | 8–10% maintenance; 12–16%+ performance/growth |
| ADF | Digestibility indicator | Under 45% |
| NDF | Intake/palatability indicator | Under 65% |
| NSC (WSC + starch) | Sugar and starch load | Under 10–12% for metabolic horses |
| DE | Caloric density | 0.75–1.0 Mcal/lb |
Pro Tip: If your report shows only ESC and starch but not WSC, ask the lab to add WSC to your next submission. NSC calculated without WSC understates the sugar load.
NIRS vs. wet chemistry: which lab method should you request?
Two main analytical approaches exist, and the choice affects both accuracy and cost.
Near Infrared Reflectance Spectroscopy (NIRS) scans the hay sample with infrared light and predicts nutrient content by comparing the reflectance pattern to a database of previously analyzed samples. It's fast, inexpensive, and reports DM, CP, ADF, NDF, TDN, ESC, WSC, starch, and common minerals in a single run. The limitation is calibration: NIRS can be inaccurate when the forage falls outside the lab's calibration set, which happens with unusual hay types, regional forages, or mixed-species samples the database doesn't represent well.
Detergent (Van Soest) and proximate analyses use wet chemistry to physically and chemically separate feed fractions. They're slower and cost more, but the results don't depend on a reference database. When accuracy is critical — feeding a horse with active laminitis, formulating a ration for a growing warm blood, or investigating a suspected mineral imbalance — wet chemistry is the more defensible choice.
For most routine hay purchases, NIRS is accurate enough and the cost savings are real. But if you're testing an unusual forage type, a regional grass the lab may not see often, or hay for a horse where a wrong number has clinical consequences, ask the lab whether their NIRS calibration covers your forage. If it doesn't, pay for wet chemistry. The price difference rarely exceeds a few dollars per test, and the confidence it buys is worth it.
When submitting, always request WSC and starch separately (not just NSC as a calculated field), and specify whether you want trace minerals. Forage nutrient composition varies with species, maturity, soil, and region, so a calibration built on Midwest timothy may not serve a barn feeding coastal Bermuda.
How to collect a hay sample that actually represents the bale
Bad sampling produces a number that describes a composite of random hay, not the bale your horse is eating. A mechanical hay corer is non-negotiable here: leaves and stems have different nutrient concentrations, and a hand-grab sample skews toward whichever fraction you happen to pull.
- Get a hay corer. Most extension offices and some feed stores loan them. The corer drives into the end of the bale and extracts a core from the center, where nutrient content is most representative.
- Sample 10–20% of the bales in the lot. For a 50-bale load, that means coring 5–10 bales. Combine all cores into a single bucket, mix thoroughly, and submit roughly a quart of the composite.
- Never mix loads or cuttings. A first-cutting grass bale and a second-cutting alfalfa bale are different products. Mixing them produces an average that describes neither.
- Label the sample clearly. Include the hay source, cutting number, purchase date, and lot identifier. This label is what connects the lab result to the bales in your barn.
- Use gloves if hand-contact is unavoidable. Skin oils and contamination can affect mineral readings.
- Ship promptly in a sealed plastic bag. Most labs accept samples by mail; check the lab's preferred container and whether they need a submission form included.
Pro Tip: Write the lot number on the bale tags with a paint marker when the hay arrives. When the lab report comes back, you can pull the exact bales the result applies to rather than guessing.
What ranges should you expect, and what do they mean for different horses?
Hay varies enormously by species, cutting, and growing conditions. Here's a practical reference for what numbers typically look like and what they mean for specific horse types.
Broodmares in late gestation and lactation. Calcium demand rises sharply. Alfalfa or alfalfa-grass mix hay often serves these mares better than straight grass hay because of its higher Ca and CP content. Check the Ca:P ratio on the report and confirm it stays above 1:1.
If the hay tests above it, soaking reduces WSC meaningfully. Pair the feeding decision with your veterinarian's input.
How to use a hay analysis to adjust your feeding program
Getting the report is step one. Translating it into a ration change is where most owners stall.
- Convert to DM and record the values. Write the DM-basis figures for CP, DE, ADF, NDF, and NSC into a tracking sheet, a spreadsheet, or a platform like Equibets' equine nutrition module that stores results by lot.
- Compare each metric to the target for that specific horse. Don't use a single target for the whole barn. A 16-hand event horse and a 14-hand easy keeper have different CP and DE requirements.
- Choose the right intervention. If DE is low, add a fat source or a higher-quality hay. If NSC is high for a metabolic horse, soak the hay and reduce or eliminate concentrates. If CP is low for a growing horse, add a ration balancer rather than more hay. If minerals are imbalanced, a targeted mineral supplement addresses the gap without adding unnecessary calories.
- Run a rough DE check. If your horse needs 16.5 Mcal/day and the hay tests at 0.80 Mcal/lb DM, he needs roughly 20.6 lbs of hay DM per day to meet energy needs from forage alone. If he's getting 18 lbs, the deficit is about 1.5 Mcal — which a small amount of concentrate or a fat supplement can cover.
- Monitor body condition and retest. Body condition score every two weeks after a ration change. If the horse's condition doesn't move in the expected direction within 4–6 weeks, recheck the math or order a new analysis.
When to call an equine nutritionist: any horse with active laminitis, a growing horse whose condition is declining despite adequate hay, or any situation where the mineral profile shows multiple imbalances simultaneously.
Pro Tip: Soaking hay for 30–60 minutes in cold water reduces WSC by a meaningful amount, though the exact reduction varies by hay type and soak conditions. Drain and feed immediately — soaked hay left sitting can ferment.
How to choose a forage lab and what to request
Not all labs are equal, and the submission form matters as much as the lab itself.
- Look for NFTA membership. The National Forage Testing Association certifies labs through proficiency testing. An NFTA-certified lab has demonstrated accuracy across multiple analytes.
- Ask which method they use for each nutrient. Specifically ask whether NSC, WSC, and starch are run by wet chemistry or predicted by NIRS, and whether their NIRS calibration covers your forage type.
- Request the right test package. For horses, a standard equine forage panel should include DM, CP, ADF, NDF, TDN or DE, WSC, ESC, starch, and a basic mineral screen (Ca, P, K, Mg). If selenium is a concern in your region, add it explicitly.
- Check turnaround time. Most labs return NIRS results within 3–5 business days; wet chemistry can take 7–14 days. Plan accordingly if you're making an urgent feeding decision.
- Confirm the cost before submitting. A basic hay analysis costs around $20; a full equine panel with trace minerals and wet chemistry will cost more. Get the price list so you're not surprised.
Two labs with established equine forage programs in the United States are Equi-Analytical (a division of Dairy One) and Dairy One's Forage Lab. Both accept mailed samples and offer online result portals. The NFTA's website lists additional certified labs by region.
Common mistakes that make your hay analysis worthless
A lab result is only as good as the sample it came from. These are the errors that most often produce misleading numbers.
- Grab sampling instead of coring. Pulling a handful from the outside of a bale gives you a leaf-heavy, stem-light sample. The corer reaches the interior where the ratio is more representative.
- Mixing loads or cuttings. A composite of two different hay sources produces a number that accurately describes neither.
- Reading the "as sampled" column for ration math. Two hays at 12% CP as sampled but different moisture levels have different actual protein delivery. Always use DM.
- Trusting visual appraisal over the report. Green color indicates chlorophyll, not protein. Smell indicates fermentation status, not sugar content. The lab number is the only reliable guide.
- Ignoring the mineral section. Owners often focus on CP and NSC and skip the mineral table entirely. A Ca:P ratio below 1:1 is a real problem that won't show up in body condition for months.
Red flags that require an immediate response:
Moisture above 17%: quarantine those bales. Mold can develop even when hay looks and smells acceptable, and mycotoxins are a serious health risk. Do not feed until you've physically inspected each bale and ideally retested. NSC above 12% for a metabolic horse: pull that hay from the metabolic horse's ration immediately and either soak it or source a replacement. Ca:P ratio inverted (P exceeding Ca): consult your veterinarian and an equine nutritionist before continuing to feed that hay as the primary forage source.
Tools and software that help you act on hay analysis data
Storing a paper lab report in a drawer is how useful data becomes useless data. The practical value of hay analysis for equine nutrition comes from connecting the numbers to the horses eating that hay, and doing it consistently across every lot.
- Store results by lot, not by date. Tag each report to the specific load it represents so you can pull it up when a horse shows a change in condition or energy.
- Track DE and CP trends over time. If your hay supplier's second cutting consistently tests lower in CP than first cutting, you can plan supplementation in advance rather than reacting after the fact.
- Auto-calculate NSC on upload. Platforms that accept lab data and calculate WSC + starch automatically reduce the manual math that leads to errors.
- Set threshold alerts. A system that flags when an uploaded result exceeds your NSC ceiling for a specific horse is more reliable than remembering to check every report manually.
Equibets' equine nutrition module supports hay-analysis workflows directly: upload results by lot, track nutritional trends across horses, and access records offline from the barn. The stable manager features let you link hay lots to individual horses so a single report update flows through to the relevant feeding records. For yards managing multiple horses with different dietary needs, that kind of lot-level tracking is where hay analysis stops being a one-time exercise and becomes a management system.
Pro Tip: Ask your lab whether they offer a digital result portal or API export. Platforms that can import lab data directly eliminate transcription errors and save time on every new lot.
When to use software vs. a consulting nutritionist: software handles storage, calculation, and trend tracking well. A consulting equine nutritionist handles interpretation when the situation is clinically complex — active laminitis, a horse not responding to ration changes, or a mineral profile with multiple simultaneous imbalances.
An editorial perspective on hay analysis in daily yard management
The gap between knowing you should test hay and actually building it into routine yard management is where most barns lose the benefit. The owners and trainers who get the most from forage analysis aren't the ones who test once and file the result. They're the ones who treat each new lot as a new variable and update their feeding program accordingly.
What changes in practice when you do this consistently: you stop supplementing by habit and start supplementing by deficit. You catch the high-NSC load before it triggers a laminitis episode rather than after. You notice that your hay supplier's fall cutting runs consistently lower in CP and you adjust your ration balancer quantity in October rather than watching your horses lose topline through November.
The recordkeeping piece is underrated. Tagging bales, storing lab results by lot, and noting body condition changes against specific hay batches creates a feedback loop that no single test can provide. Over a season or two, that data tells you more about your hay source's consistency than any single report.
One thing worth saying plainly: hay analysis is not a substitute for veterinary care in horses with metabolic disease. The NSC number tells you what's in the hay. Your vet tells you what that means for that specific horse's insulin dynamics, history, and current status. Both inputs are necessary.
Equibets makes hay analysis part of your yard's daily workflow
Hay analysis for equine nutrition is only as useful as the system you use to act on it. Equibets gives professional yards a single place to store lab results by lot, link them to individual horses, and track nutritional trends over time without spreadsheets or paper files.

The equine nutrition module accepts hay analysis data, calculates key metrics including NSC, and flags results that fall outside the thresholds you set for each horse. The offline mobile app means you can pull up a lot's lab report from the barn aisle, not just from the office. Every feature, including stable management, owner portals, and finance tracking, is included in one plan with no module fees.
Start a free trial at Equibets and connect your next hay analysis to the horses it feeds. For horses with active metabolic conditions, always confirm feeding decisions with a qualified equine nutritionist or veterinarian.
Sources
- Understanding your hay analysis
- Understanding a Hay Analysis (Penn State Extension)
- Analysis of Feeds and Forages for Horses (Rutgers NJAES) - FS714
- Nutritive value of feeds for beef cattle (Oklahoma State Extension)
- Hay Testing: When, Why, and What Do the Results Tell You? (My New Horse / Equus, 2026)
Store every lab report digitally, tagged to the lot and the horses it fed. Over time, that archive is one of the most useful documents in your barn.